Yesterday we had a snow day.
Today we started off the class with a Christmas Trivia. After that we did Mental Math, then Mr. Max gave us the Binomial Distribution booklet. There are 12 questions that are due tomorrow. We aren't sure when the test is still, if we are having it on Thursday or after the Christmas Break.
Tuesday, December 15, 2009
Friday, December 11, 2009
Z-Scores
Big Idea:
*Relative scores(your score compared to others in the same data set*
Formula:Z=(x-xbar)
Std.Dev.
*Z-Score values should be between -3.5 and 3.5*
Normal Distributions
Normal Distributions are "theory and practice", they are frequently polygons and histograms.
Characteristics of Normal Distributions:
Characteristics of Normal Distributions:
*Theoretical(approximation)*
*Symmetry about the mean*
*Follows the rule - 68-95-99.7*
*mean=median=mode*
Ways to figure out Normal Distributions:
*www.ronblond.com-Gr.12-areas under the normal distribution/x&z values*
*Graphing calculator: 2nd-vars-normal cdf-low value, high value, mean, standard deviation*
Thursday, December 10, 2009
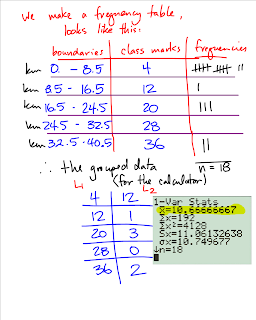
Ungrouped Vs. Grouped Data
Ungrouped-All data values are present and accounted for.
Grouped-Frequency tabled
A frequency table looks like this:(Using the same data for how far we live from school)
Monday, December 7, 2009
Population Standard Deviation
Population Standard Deviation(little sigma x)- the measure of variability within a data set.
Range-also a measure of variability(the highest subtract the lowest)
We can find this number with our calculators. Go into STAT, edit, and edit a list. Once done that, go to STAT, CALC, 1-Var Stats, then select the list you edited.
It can also be done on the spreadsheet we made, found in my math folder.
Standard Deciation measures how varied the data is, relative to itself(how spread out the numbers are) The formula is too hard to type out, but is "the square root of the quotient between the sum of all x subtract x bar squared, divided by n"
Variability and Statistical Analysis
On Friday we looked at the measures of central tendency.
Median-Known in the calculator as med. "The middle number when ascending or descending." If the middle of the data is 2 numbers, the median is the average of those 2 numbers.
Mean- Know in the caclulator as an x with a line over it(x bar). "The sum of all the x-values divided by n"
Median-Known in the calculator as med. "The middle number when ascending or descending." If the middle of the data is 2 numbers, the median is the average of those 2 numbers.
Mean- Know in the caclulator as an x with a line over it(x bar). "The sum of all the x-values divided by n"
it = SIGMA x
n
Mode-Known in the calculator as mode. The most frequently occuring. Note that the mode may not exist, or there may be multiple modes.
Tuesday, December 1, 2009
Computer Down
Yesterday Mr. Max's computer was down for the first half of class at least so we just worked on our Probability Exercises and Accelerated math. We have our test on Thursday, so to make sure we do good on the test we should do the accelerated math.
Subscribe to:
Posts (Atom)